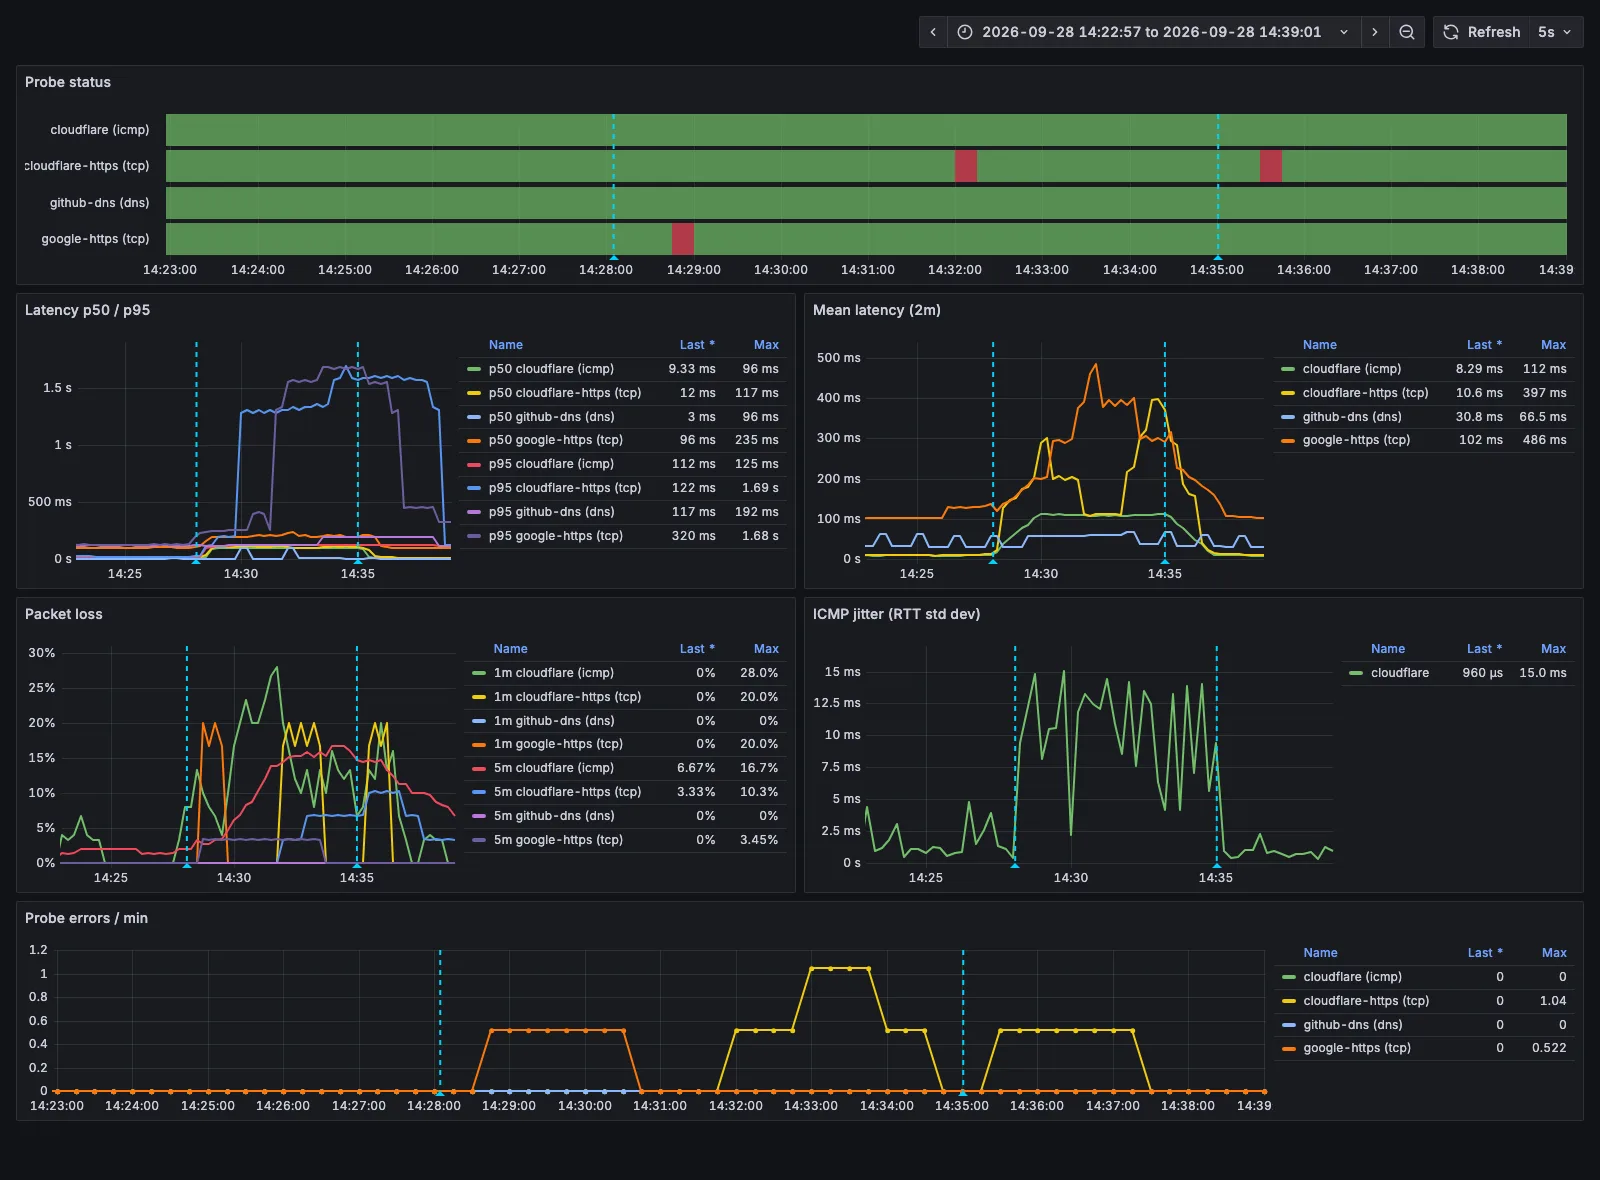
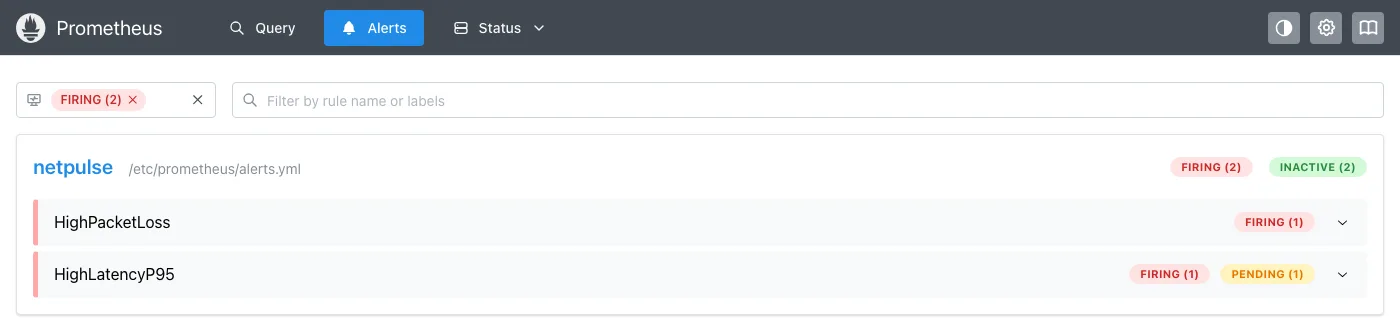
Most uptime checks answer one question: is it up? NetPulse asks how well the network is working. It probes each target over ICMP, TCP or DNS and exports latency, jitter and packet loss to Prometheus, with Grafana dashboards and alerts for outages, loss and slow p95 latency.
Testing it against real faults
A monitor is only useful if it catches real problems, so I broke the network on purpose. A script runs tc netem inside the container to add 100ms of delay and 10% packet loss, watches Prometheus for alerts, and writes a report with time-to-detect and before/during numbers.
ICMP matched the fault closely. TCP was the surprise: the probes showed no loss at all, because the kernel quietly resends a dropped SYN and the handshake still finishes, just a second late. The loss only shows up as a jump in TCP p95, which is why NetPulse watches TCP latency alongside ICMP loss.
BGP failover lab
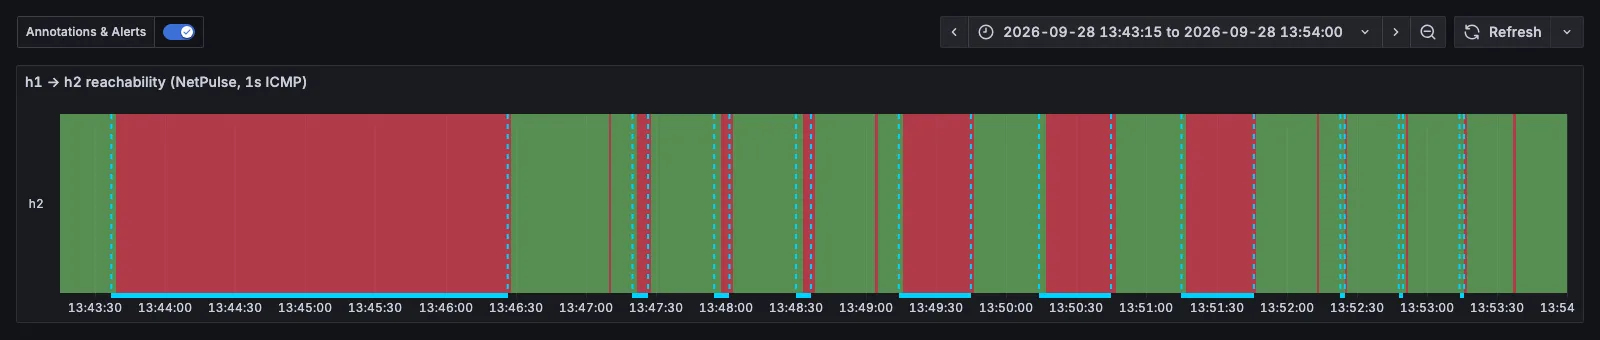
The second part is a lab with three FRRouting routers in an eBGP triangle, with NetPulse probing across it. I black-holed the direct link while leaving it "up", which is the hard kind of failure to detect, and measured how long traffic took to move to the backup path.
Default timers took 170s. Tuned timers took 6.5s. Turning on BFD alone took 31s, because FRR waits a 30s hold time after BFD spots the failure, and adding a strict hold time brought it down to 1.9s. The lab also showed that ping can't be trusted to time outages, because it slows down while replies go missing.
How it's built
Go, Prometheus and Grafana run in Docker Compose. NetPulse uses unprivileged ping sockets, so it runs as a non-root user in a distroless image with no extra privileges. Config is checked at startup, and the tests run with the race detector on.